
Goshuin Database Coverage Across Japan
The five most documented prefectures hold 72.9% of all prefecture-linked records in this snapshot.
These charts show where the public database is deep, where it is thin, and which questions this snapshot cannot answer.
By
Goshuin Database Research
Snapshot
July 26, 2026 at 12:01 PM
Use
- Public records
- 260
- Temples represented
- 183
- Prefectures with linked records
- 25 / 47
- Reading rule
- Every figure describes this database snapshot, not the prevalence or frequency of goshuin in Japan.
Where records are most concentrated
The ranking starts with the prefectures that have the most linked records. It shows where editorial coverage is strongest and where there is still little to read.
Tokyo and Kyoto currently lead this ranking.
A longer bar means that more records are linked to that prefecture in this snapshot. It does not measure cultural importance or how often goshuin are issued.
Bars open the underlying prefecture view
Which prefectures are represented
Each mark stands for one of Japan’s prefectures. Vermillion indicates that at least one public record is linked to that prefecture.
- Represented
- 25 / 47
- Not yet represented
- 22
From the live database
What sits behind a count
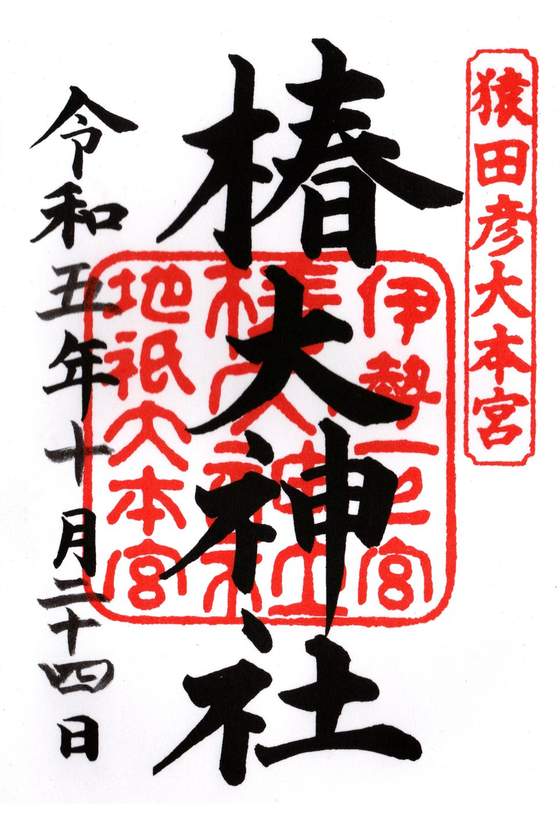
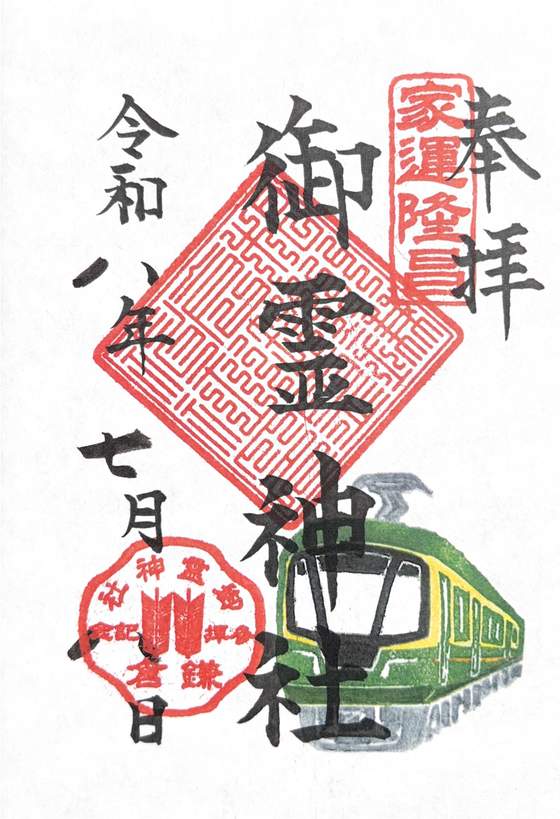
A bar is made of individual records like these. Each one keeps its own record ID, issuing place, image, and verification state.
How quickly the records concentrate
Starting with the most documented prefecture, the line adds one prefecture at a time. A steep opening means a small group holds much of the published collection.
Interpretation
The first five prefectures account for 72.9% of prefecture-linked records.
Focus or point to any mark to read its rank and cumulative share. The flatter tail is made up of prefectures with only a few published records.
Temple reach and record depth are not the same
Two prefectures can hold similar record totals for different reasons: many represented temples or several designs from fewer temples.
Temple reach and record depth are separate.
Focus or point to a mark to compare its exact counts. Logarithmic axes keep the smaller values visible.
Depth per represented temple
Dividing record count by represented temples shows where the database has documented multiple designs per place.
- 01Hyogo4
- 02Chiba2.25
- 03Fukui2
- 04Shizuoka2
- 05Kanagawa1.81
- 06Hiroshima1.67
- 07Kyoto1.47
- 08Osaka1.44
- 09Tokyo1.42
- 10Nara1.31
Derived measure
Public records per represented temple
Focus or point to a row to isolate it. A higher ratio means more distinct designs have been documented per represented temple, not that the temples issue more goshuin.
Verification and making methods
The final pair of charts reports the verified share of public records and the making methods currently tagged.
Verification share
Public records carrying curator or temple verification.
- Verified
- 260 · 100%
- Other verification states
- 0
Making-method records
Public records grouped by the creation methods currently tagged in the database.
- Handwritten203
- Paper cutting21
- Printed14
- Special Printing5
- Embroidered2
Source records
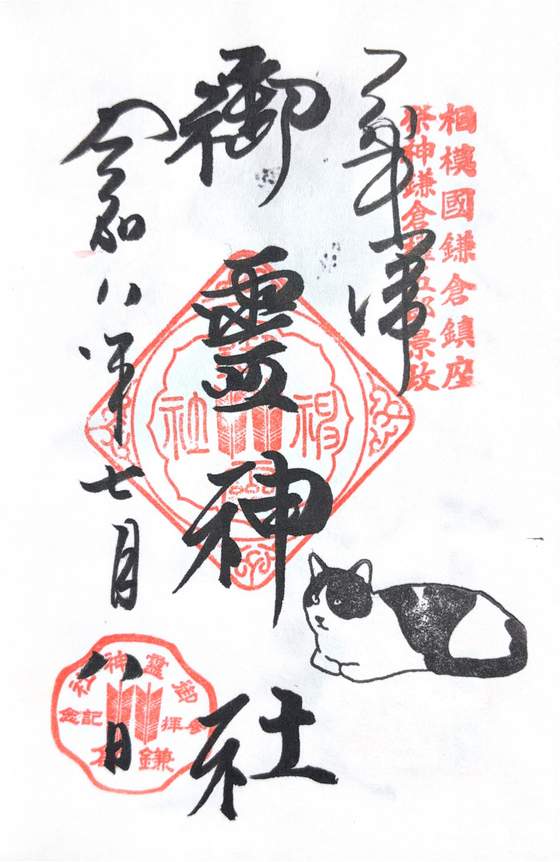
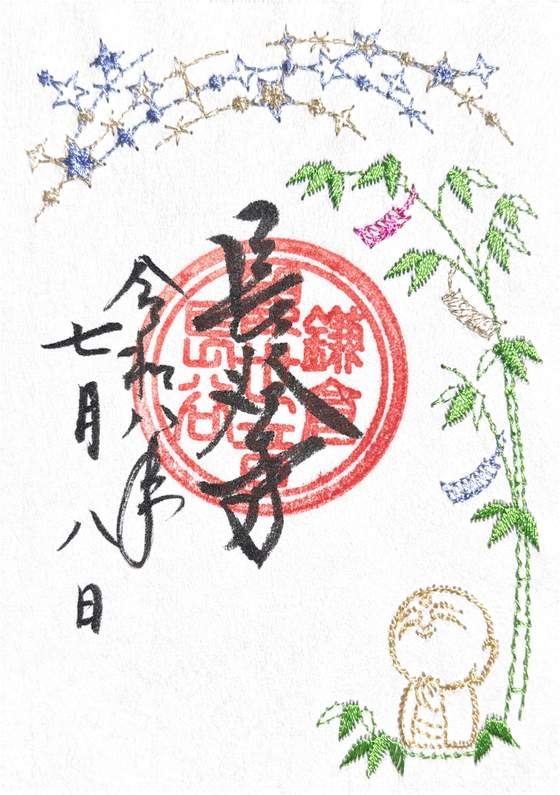
Read the records, not only the totals

How the numbers were made
The page reads live, public Goshuin Database aggregates. It ranks prefecture counts, adds those counts for the concentration curve, and divides designs by represented temples for the depth ratio. The scatter plot uses logarithmic axes so prefectures with smaller counts remain visible.
Limits of this snapshot
The public data does not include a census of every issuing temple, a historical time series, issuance frequency, visitor frequency, or a denominator for true completeness. A missing record marks a research gap. It does not mean that a goshuin does not exist.
Public data sources
get_goshuin_database_stats
get_goshuin_database_prefectures
get_goshuin_database_homepage
Snapshot generated
July 26, 2026 at 12:01 PM
Regenerated weekly. Failed runs retain the last successful snapshot.
Suggested citation
Goshuin Database Research. (July 26, 2026). “Goshuin Database Coverage Across Japan.” https://database.goshuin.com/en/research/coverage
Read the complete prefecture data table
| Rank | Prefecture | Goshuin | Temples | Goshuin / temple | Cumulative share |
|---|---|---|---|---|---|
| 1 | Tokyo | 71 | 50 | 1.42 | 27.8% |
| 2 | Kyoto | 56 | 38 | 1.47 | 49.8% |
| 3 | Kanagawa | 29 | 16 | 1.81 | 61.2% |
| 4 | Nara | 17 | 13 | 1.31 | 67.8% |
| 5 | Osaka | 13 | 9 | 1.44 | 72.9% |
| 6 | Wakayama | 11 | 10 | 1.1 | 77.3% |
| 7 | Chiba | 9 | 4 | 2.25 | 80.8% |
| 8 | Tochigi | 7 | 6 | 1.17 | 83.5% |
| 9 | Gifu | 5 | 5 | 1 | 85.5% |
| 10 | Hiroshima | 5 | 3 | 1.67 | 87.5% |
| 11 | Fukui | 4 | 2 | 2 | 89% |
| 12 | Hyogo | 4 | 1 | 4 | 90.6% |
| 13 | Nagano | 4 | 4 | 1 | 92.2% |
| 14 | Shizuoka | 4 | 2 | 2 | 93.7% |
| 15 | Ishikawa | 3 | 3 | 1 | 94.9% |
| 16 | Mie | 3 | 3 | 1 | 96.1% |
| 17 | Yamanashi | 2 | 2 | 1 | 96.9% |
| 18 | Aichi | 1 | 1 | 1 | 97.3% |
| 19 | Hokkaido | 1 | 1 | 1 | 97.6% |
| 20 | Iwate | 1 | 1 | 1 | 98% |
| 21 | Kumamoto | 1 | 1 | 1 | 98.4% |
| 22 | Nagasaki | 1 | 1 | 1 | 98.8% |
| 23 | Niigata | 1 | 1 | 1 | 99.2% |
| 24 | Saitama | 1 | 1 | 1 | 99.6% |
| 25 | Shiga | 1 | 1 | 1 | 100% |